Making a heat map effect for Toxin
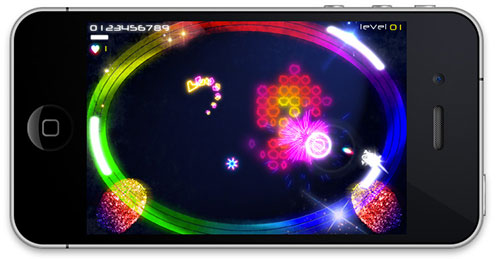
As you might already know my forthcoming iOS game, Toxin involves shooting rapidly dividing toxic cells which eventually fill the playfield or burst to spawn flying enemies.
Now, not long ago I read an article about generating heat maps to display web statistics, and I thought it would be cool to use this technique to colourise the ever changing clumps of cells in Toxin. After finding out how they work, I knocked up a prototype in Processing before adding the effect to the game.
Generating heatmaps is pretty simple. Take a 2d grid of values, perform a Gaussian blur on it, then use each resulting value as an index into a gradient of colours.
For Toxin, the first step was to create a simple array of numbers representing the current state of the cell grid. Toxin cells can be different sizes. To simplify things, I store each big cell as several small cells.
Each cell is given an initial value of 255. When we draw our cells, we use a range from black to white, where values of 0 are black, 255 is white and values in between are shades of gray.
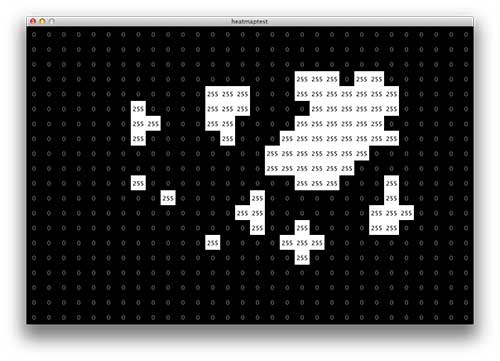
The cells are represented as a grid of numbers. Each cell is given the initial value of 255
The next step is to apply a simple box blur to this grid of numbers. Normally heat maps use Gaussian blur, but since Toxin’s grid is such a low resolution we can get away with using a simpler algorithm which is much faster to calculate. To learn more about blurring techniques, I recommend Alex Evan’s article on Gamasutra.
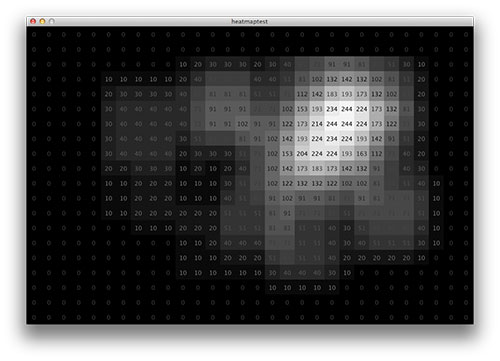
The cell grid after being blurred. Notice how the values have changed
Now look what happens when we draw our original cell grid using the values from the blur operation. Cells in the middle of large clumps have higher values than solitary cells.
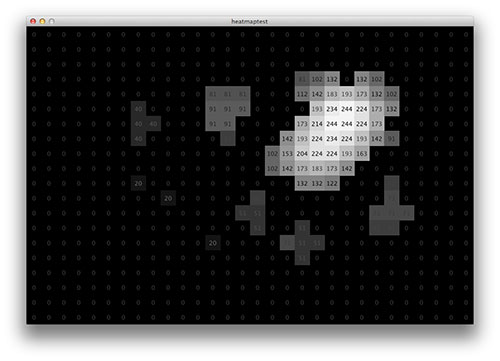
Drawing the original grid with the blurred values
The final step is to colourise these grayscale values so they look cool. We do this by mapping these values onto a gradient I made in Photoshop. Values of 0 map onto the left of this gradient, 255 to the right, and the others to the colours in between.
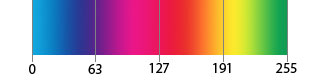
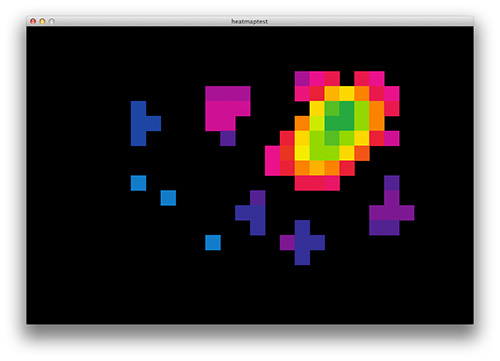
When we draw the grid with the colours from the gradient we get our heatmap!
0 Comments